Voter Support Of the RAPID in 2017
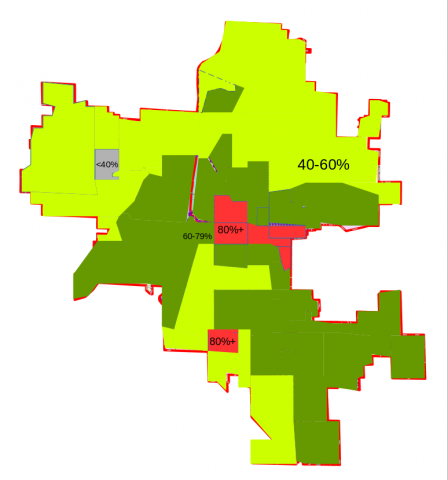
This is a map of voter's support of RAPID funding in November 2017. Creation of this map was inspired by the "Transit Supporter Split" BLOG post. That post, at least proposed, that in the city of Portland [Oregon] that transit support had a conical shape: strongest downtown, tapering down as one moved out through the neighborhoods, and zeroing out into opposition when one reached the true suburbs. It raised the question of what support for the RAPID looks like in Grand Rapids. Fortunately precinct level data was available so I was able to make this quick-n-dirty map.
In short, support is not concentrated in downtown, it holds nothing like a conical shape, and it also does not track where the RAPID has the greatest mode share.
So does it track "urban form"? It does not appear to. In terms of following urban form strong support also does not appear consistent with locations of intense growth such as the Bridge St. corridor on the West Side or the Wealthy St. corridor to the south; although the support through Midtown along the Michigan St. corridor is the strongest in the city. A historian might see an echo in the supporting regions - they generally follow the existence of rail right-of-way through the city. But these companies have not provided any passenger service for ~50 years, the great majority of the people living in those areas would have no memory of such service.
The highest commuter mode-share for the RAPID within the city [as of the 2010 census] was the block corresponding closely to Ward#1 Precinct#18 with an impressive 12.5%. Yet the support there is modest. It is also interesting that the support "downtown" is not especially strong; it is generally assumed in Urbanist circles that city center residents are the strongest supports of transit [like many assumptions this is perhaps distinct from reality].
The weakest support being in the northern portion of the city makes sense as service in that area is the weakest. The density of the city declines significantly as one moves north. Geography and a broken street grid also make service challenging in the northern reaches of the city.
For anyone familiar with Grand Rapids's political landscape the pocket of out-right opposition, gray on the map, is exactly where one would expect.
The map provides no clear answers. What are the principle drivers of support if not urban form or utilization? Perhaps support is correlated to age?