Mobility Update, 2023-10
Micromobility
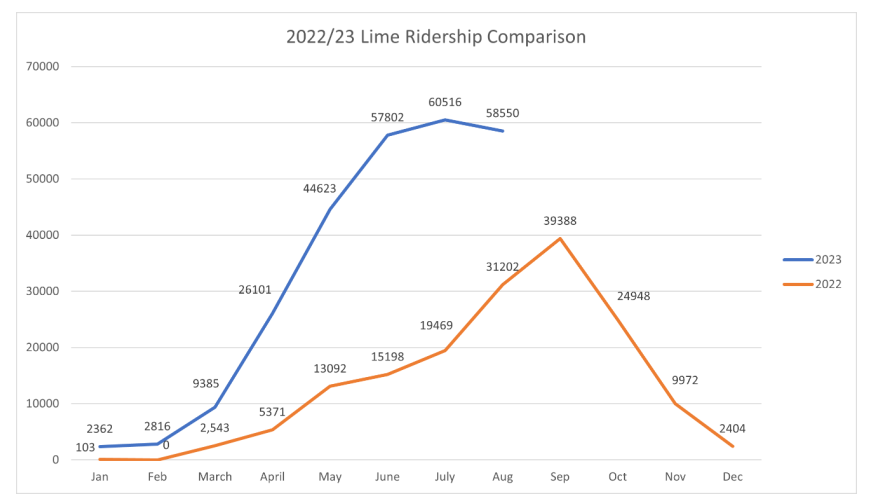
Use of micromobility service (scooters and e-bikes) has increased 201% between 2022 and 2023. 2022 was a total of 163,690 rides, and 2023 January - August has already seen 262,155 rides.
The average trip distance is 1.1 miles and 15 minutes in duration. The most popular destination pair zones (DPZs) are: Monroe / Lyon, Broadway / Bridge, Pearl / Monroe (West), Summer / Bridge, East Fulton / Ionia. While the most popular DPZs are what one would expect the trip heat map shows intensified use in the neighborhoods.
2022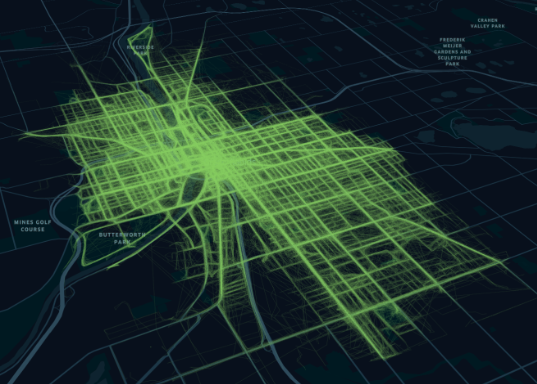 |
2023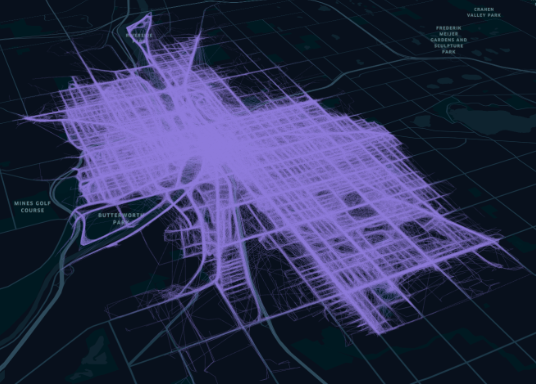 |
The Rapid
The Rapid continues to work on their new Master Plan: 👉"Thriving"👈. Several online engagements are available; readers are encouraged to provide their input to the Rapid.
Some of the most interesting take0aways from data so far are:
- More than 95% of block groups supportive of 30-minute service are within 0.25 miles of a route with 30-minute or better service.
- The high demand transit corridors are already serviced by the Rapid’s fixed routes or Rapid Connect zones.
- The highest demand transit corridors are currently served by the Laker Line and Silver Line.
- The highest demand area not currently well serviced is in Kentwood [no, its not the airport]
- 62.1% of the city of Grand Rapids is within 0.25 miles of a bus stop.
- 64% of residents of the six-city Rapid service area are within a 5-minute walk of a bus stop
- 64% of riders use the Rapid as their primary mode of transportation, or use it more than four days a week.
- Only 52% of Rapid riders are primarily commuters.
- 75% of jobs within the service are are within a 10 minute walk of a bus stop.
The time line for the development of the Rapids' Master Plan is:
Related
The DASH
The DASH routes North & West were combined into the single DASH v2.0 bi-directional circulator in May of this year (2023).
Ridership:
| Year | May | June | July | August |
|---|---|---|---|---|
| 2016 | 14,649 | 15,379 | 13,139 | 15,692 |
| 2017 | 23,292 | 24,271 | 23,331 | 28,954 |
| 2018 | 32,287 | 30,013 | 28,691 | 30,138 |
| 2019 | 44,618 | 44,643 | 48,590 | 55,171 |
| 2020 | 2,825 | 20,576 | 22,619 | 24,498 |
| 2021 | 20,200 | 20,589 | 20,173 | 19,871 |
| 2022 | 29,358 | 23,816 | 29,350 | 32,036 |
| 2023 | 7,028 | 19,974 | 18,946 | 19,782 |
The service, as with the Rapid overall, continues to struggle with a shortage of drivers. Monday and Tuesday service is still not available for that reason.
The construction of the round-about at Coldbrook, Monroe, & Ionia has resulted in the DASH being on detour for the majority of 2023.
The most utilized stops on the DASH clockwise service for boarding: Museum district, Skate Park, Main Library, Heartside Park, and Ionia-McConnell. The most utilized stops on the DASH clockwise service for deboarding: Museum District, Main Library, Arena South, Skate Park and Bridge Street.
The most utilized stops on the DASH counter-clockwise service for boarding: Rapid Central Station, Main library, Bridge Street, Rosa Park Circle and Las Canchas. The most utilized stops on the DASH counter-clockwise service for deboarding: were Rapid Central Station, Bridge Street, Broadway Ave, Heartside park, and Main Library.
The highest utilization of the DASH in either direction is consistently the afternoon (noon - 4pm), peaking on Fridays.
Cycling
The separated bike lane on Turner Ave NW (4th St and Leonard ) has been completed. The second phase of this project (Leonard to Ann) will be constructed in September and October.
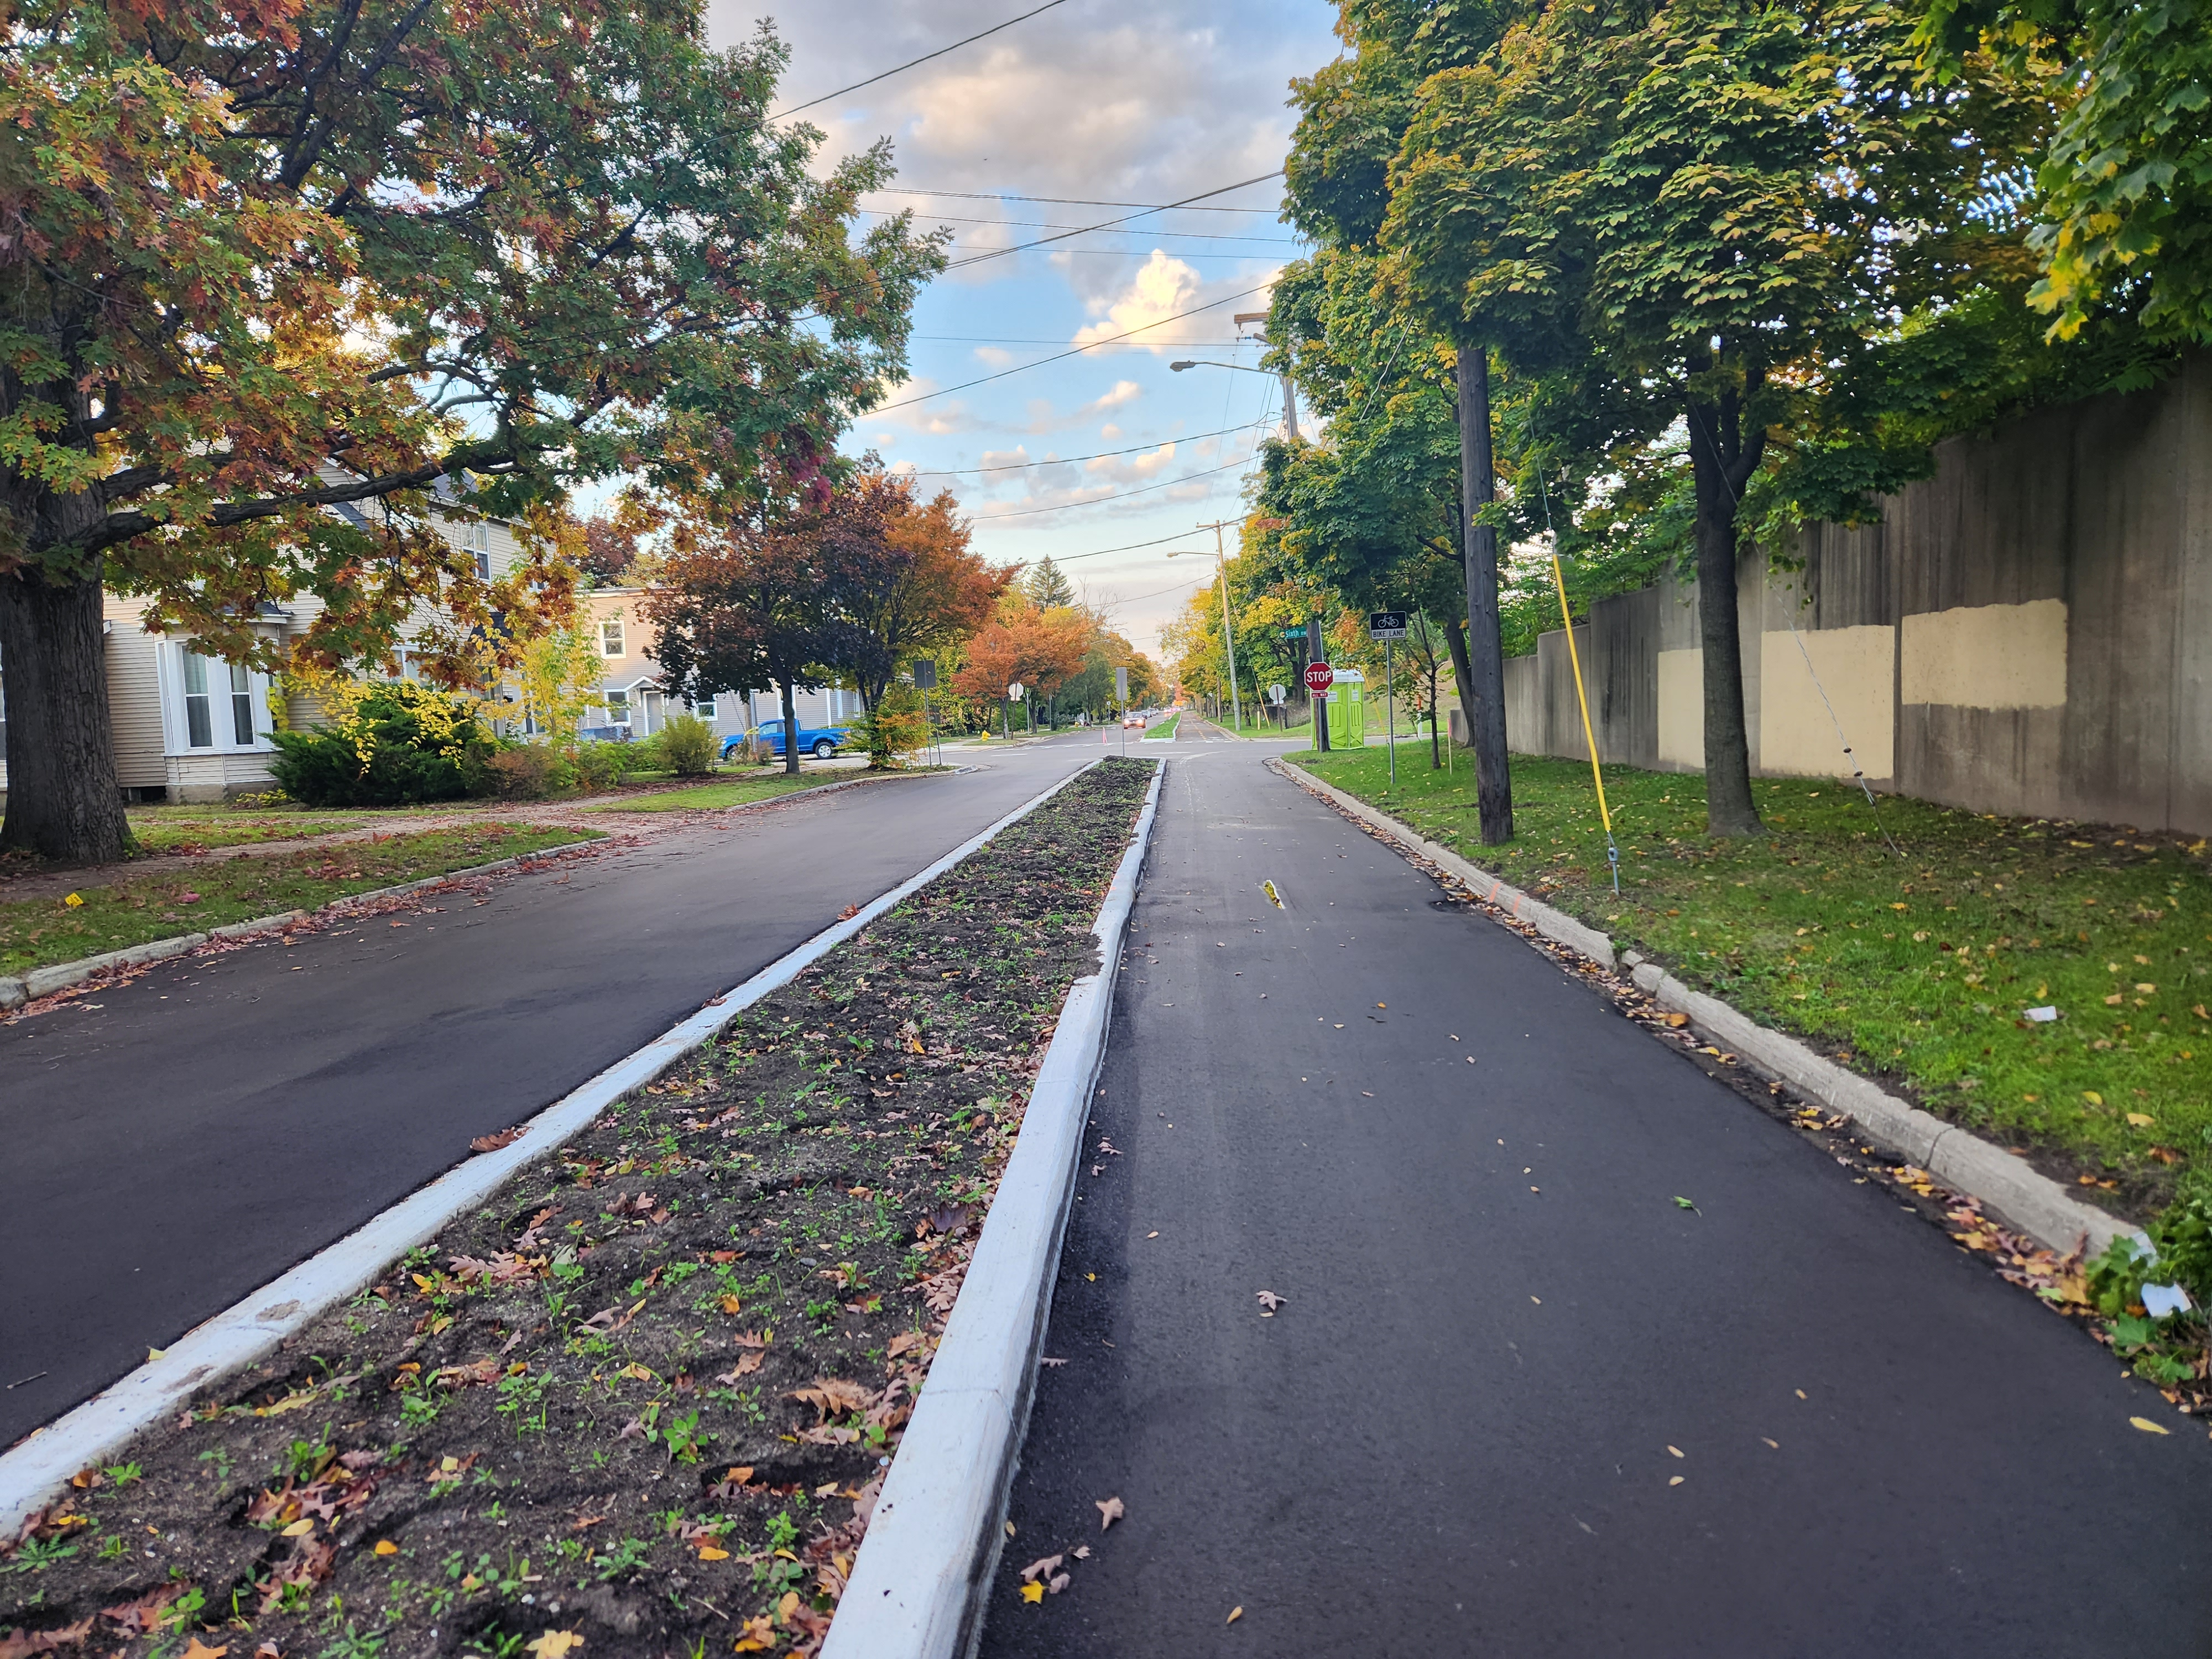
The new round-about at Coldbrook, Monroe, & Ionia will include through bicycle facilities and bike lanes will be added to Clancy St.
The MobileGR department has hired a consultant to assist with refreshing the Grand Rapids's Bicycle Action Plan. This update should also result in a project work program.
MobileGR remains significantly underfunded compared to peer cities, this forces them to rely excessively on outside services rather than developing the internal capacity which would facilitate more efficient and rapid deployment of infrastructure. Hopefully the adequate funding of MobileGR in the 2024/2025 budget will be a focus of advocacy in the coming months.
Parking
This city has too much surface parking and the City Commission continues to neglect parking policy as a component of city-building.
Parking Rates
The city's median rate for monthly parking is $140 compared to $178 for private operators. The city's highest rate for special event parking is $15 versus $30 for private operators.
In Grand Rapids street parking is enforced ~50 hours per week compared to an average of 75 hours per week in comparable municipalities.
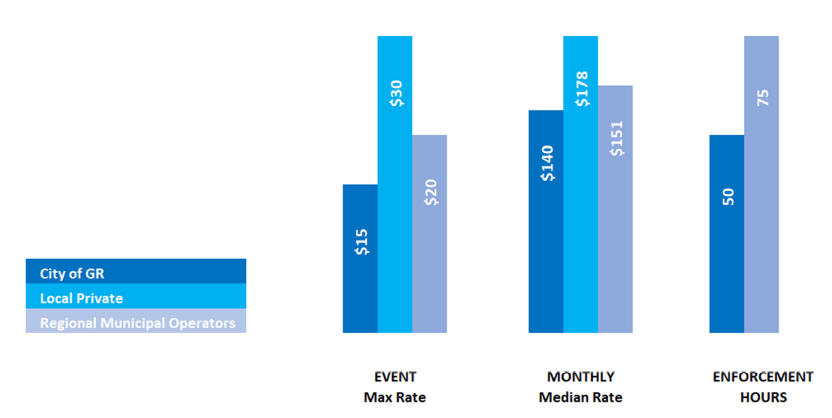
The city is leaving money on the table.
The first phase of parking rate changes - - - a topic which has been under discussion forever - - - will be to restore the fiscal solvency of the MobileGR department. Parking is an extremely expensive service to provide and the department has fallen behind, financially, due to the COVID19 pandemic and other factors.
🎆A Victory🎆
At the October 26th Planning Commission meeting Corewell Health presented a request to demolish several previously occupied buildings in the Monroe North neighborhood in order to build ... 🥁🥁🥁 .... surface parking lots. They claimed the now vacant buildings were "blighted" and "obsolete"; buildings only vacant after having been purchased by Corewell, then Spectrum, Health. They promised to make some greenspace [private property with grass?] and to possibly build some housing at some point in the future. This all after having been allowed to exceed the city's parking maximum by 20% in phase #1 of their Monroe North development.
This proposal was counter to the GR Forward Plan, the Monroe North ASP, the Michigan St. Corridor plan, and basically every goal the city has set in the last twenty years. Would that matter? The City Commission has failed to follow through on any of those plans with corresponding policy, leaving this in "Special Land Use" limbo. This should not have been on the table.
Corewell Health is politically connected, and one of the regions largest employers. In conversations about this proposal I was told numerous times that Corewell gets to "play by a different set of rules". The silence of the City Commission serves to validate that hopelessness.
But you spoke! And you where heard!. The Planning Commission tabled Corewell's terrible very bad plan. Being tabled is not a clean win, but it does say then when the citizens of this city speak there are those willing to listen. Corewell will be back, they will probably still want lots of parking. And we'll be back. The fight is worth fighting. Thank you to everyone who partcipated, sent an e-mail, or spoke at the meeting.
RELATED:
- Planning commission tables Corewell Health request to demolish 5 buildings for parking lots, Crains 2023-10-26
- ‘This request is extreme.’ Corewell Health proposal to demolish buildings for parking lots tabled, Mlive 2023-10-26
Recovery
Comparing parking revenue from ArtPrize 2021, 2022, and 2023 demonstrates a strong recovery.
| Category | 2021 | 2022 | 2023 |
|---|---|---|---|
| On Street Transactions | 38,682 | 40,543 | 47,047 |
| Off Street Transactions | 91,143 | 86,964 | 89,842 |
| On Street Revenue | $81,067 | $85,801 | $105,006 |
| Off Street Revenue | $593,576 | $594,046 | $910,180 |
Ridership on the Amtrak Pere Marquette recovered in 2022; 2023 remains on track to match that recovery as we head into the peak ridership months.
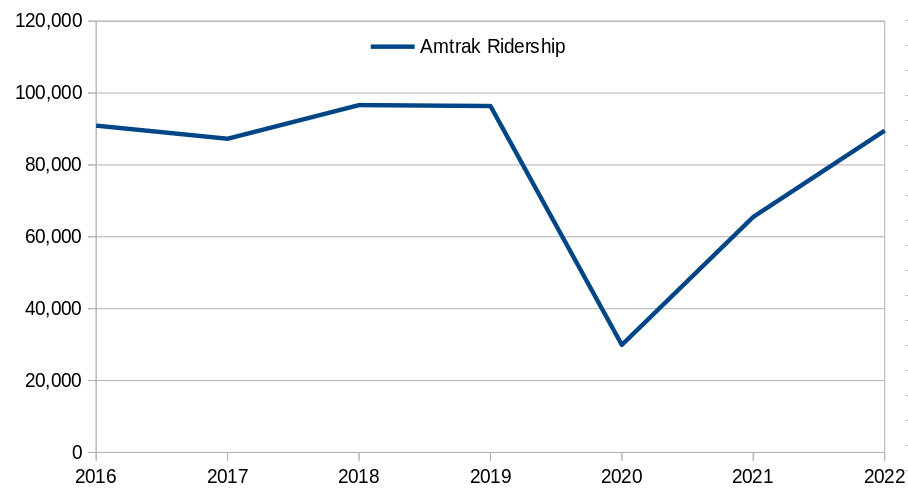
This is important. The death of cities and downtowns has been predicted over and over again. During the COVID19 pandemic we all saw a wave of articles like 🙄"What Bars Will Look Like After Coronavirus"🙄; so many talking-heads pondered the question of if people will ever go to bars again. All those deep thinkers have been proved to be either fools or click-bait trolls. Cities do not merely endure; people, even Americans, love cities. And just as certainly as cities will continue to thrive the greatest challenge to American cities remains their own governments. We must elect people who believe in our cities, ensure our city's staff have the resources to do what is necessary, and that they have leaders who will stand behind them when they make the decisions necessary for our city to be the greatest city possible.