Mobility Update: 2024-02-12
There has been a great deal of mobility news in the past few months; 2024 is shaping up to be a big year.
With Strongtowns GR and Slow Streets the city of Grand Rapids once again has an advocacy scene. And not a moment too soon. The state legislature and the Whitmer administration remain in a state of bi-partisan disinterest regarding urban issues, especially concerning transportation and mobility. Meanwhile the fiscal cliffs loom ever nearer, climate change rages, and economic inequity remains entrenched. The time for change was not yesterday, it was a decade ago, but we can only go forward from today.
Some Data
It is important to frame the conversation about mobility in hard data. There are many perceptions about transportation in the city, who is traveling/commuting, how, etc.. Most of those perceptions are not accurate. This is especially important for those concerned with economic opportunity or equity, the ability of lower-income households to successfully navigate the city.
Census Data
"Everyone drives" is a statement too often heard, when here is vehicle ownership per household for the city of Grand Rapids.
| Vehicles | Owner-Occupied | Rental | Total |
|---|---|---|---|
| 0 | 4.2% | 21.6% | 12.1% |
| 1 | 32.4% | 47.7% | 39.1% |
| 2 | 44.8% | 22.5% | 34.6% |
| 3+ | 18.6% | 8.8% | 14.2% |
Given the first row of this table ... who are we hearing when we hear those kind of statements? Community engagement is always a fraught effort; virtuous in theory, consistently regressive in practice. A good example of the dilemma posed by the unrepresentative nature of community engagement is the recent meeting hosted by the Heritage Hill Neighborhood Association concerning land-use reform; in a neighborhood where two thirds of the residents are renters, more than nine (9) out of ten (10) participants [it was 91%] were property owners. The results were what one would expect. The transit planner Jarrett Walker refers to this effect we see from community engagement as "Elite Projection": the normalization of the perspective of the most affluent - and thus older and whiter - citizens. Anyone who has attended such meetings knows that statements like "people are going to drive" / "everyone drives" are rarely challenged, even if contrary data is on display.
Taking only the lowest number in the first row of the table - 4.2% - as if it applied to all categories we would have nearly one (1) in (20) twenty households. In a city of ~84,397 households 4.2% would be 3,544 households. A not insignificant number, well outside of the "nobody" implied by statements about "everybody". Our city should not only acknowledge the existence of the people who live in these households, it should embrace them. If considered only in cold economic terms: no-car and low-car households spend their money in our neighborhoods, at business that employ people who are paying city income tax. Cultivating neighborhoods of low-car households is economic development.
Financial Facts
The average cost of car ownership in America surpassed $12,000/yr in 2023. The current average auto-loan payment is $1,015/mo. The average cost of a new car in 2023 was $34,876, up 4.7% from 2022.
Delinquency rates on auto loans are also at a 30 year high; more households are more than sixty (60) days behind on their auto loans than at any point since October of 1996. More than 1 in 20 households with credit scores between 500 and 600 are delinquent; that range represents the approximately one (1) in three (3) American households categorized as "sub-prime". This is not much of a surprise when the interest rates for auto-loans to subprime households are as high as 19%, averaging greater than 11% for the purchase of new vehicles and higher for used vehicles.
I think about these statistics whenever I see one of the many op-eds about how American's perception of the economy is lower than the core economic statistics suggest they should feel. Yet layer this transportation affordability crisis - which our civic leaders refuse to see - on top of housing affordability, on top of generalized uncertainty, and is the negativity difficult to understand? A recognition of the fiscal non-viability of the American transportation regime requires more courage than most of our nation's leaders poses. Doubly so in a state like Michigan where our oligarchs have deep ties to the auto industry.
The Rapid
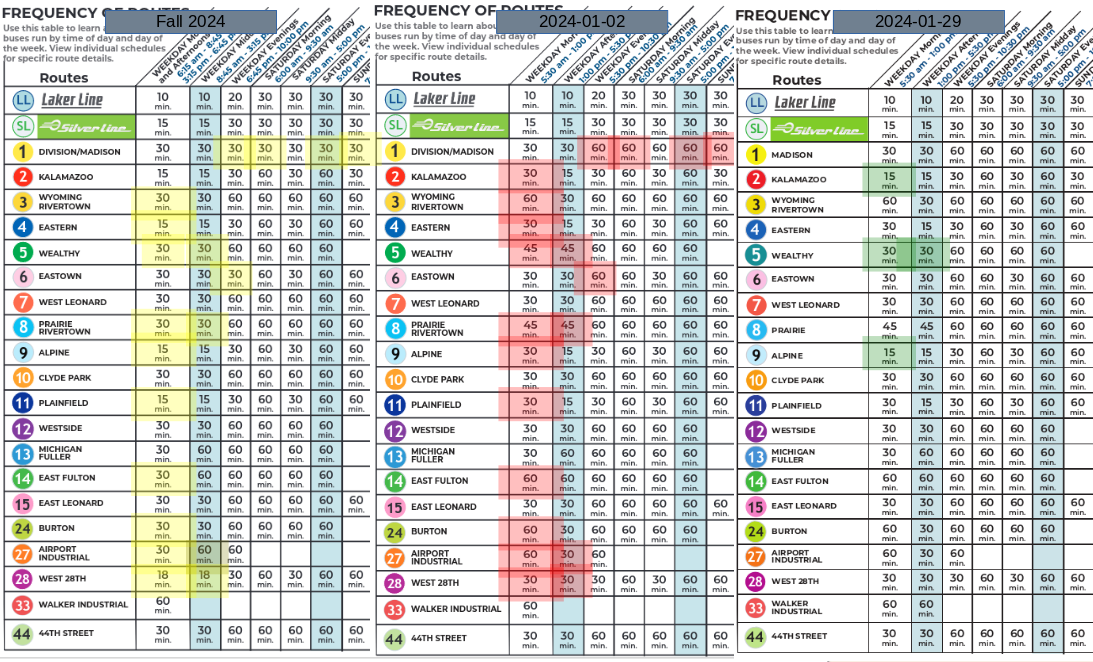
Frequency Restoration
After workforce induced service cuts on January 1st the Rapid has been able to recruit and realign its staffing to restore frequencies on three (3) routes beginning January 29th. The restored routes are #2, #5, and #9
The DASH v3.0 will also begin seven day a week operation, for the first time since the inception of the service. Beginning January 29th (2024) the new DASH v3.0 schedule is:
- Monday through Friday: 7:00am - Midnight
- Saturday: 11:00am – 1:00am
- Sunday: 11:00am – 5:00pm
The DASH WORK service hours have also been extended, Monday through Friday, from 6:30am until 6:30pm. The DASH WORK service connects the heart of the CBD to the parking oceans on the west-side. The frequency of the DASH WORK is the same as for the DASH v3.0: 15 minutes. While oriented towards serving park-n-ride commuters the 6:30pm service hours are still useful for reaching the west side for dinner or other appointments from the many Rapid routes which serve central business district.
Circulator; v3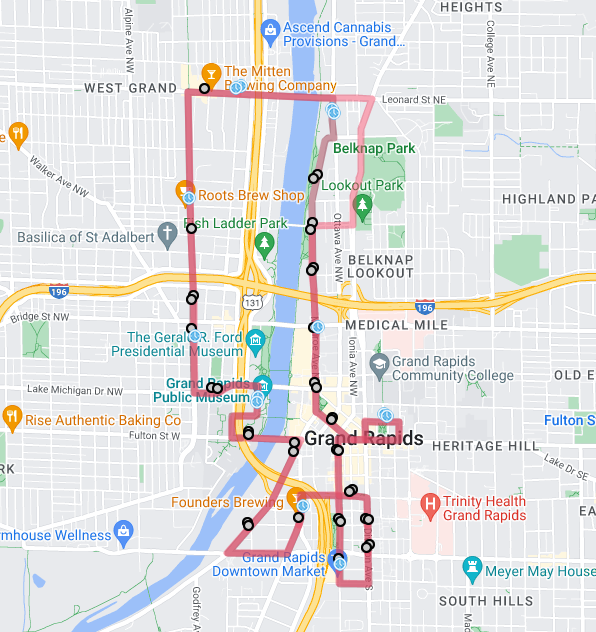 |
Work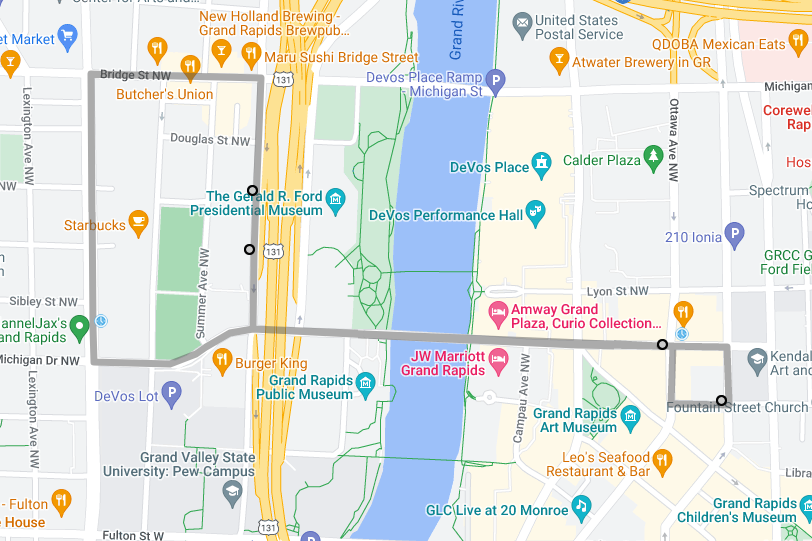 |
Central Station Renovation
Hard to believe, but the Rapid Central Station (RCS) is twenty years old. In 2004 the new RCS unified inter-city bus and municipal transit in a single station; it was also the first LEED certified transportation center in the United States. Subsequently there has been the addition of the Silverline BRT station [2014] and the adjacent Amtrak station [also 2014, due to many delays].
Twenty years is a long time for a heavily used facility, and needs change. Beginning this year we will see the initial steps in a full renovation of the station. First will be the information center. As the inter-city bus counters are no longer used that space will be converted for use by security staff and other purposes.
Hopefully this renovation will bring electronic displays for arrivals and departures which actually work. Working transit information displays are incredibly rare in the United States.
- Request For Proposal (RFP), RAPID 2022-08-23 (PDF, 39 pages).
From both the renovation RFP and the minutes of the December meeting of the Rapid board it appears that the concept for a childcare facility operated at Rapid Central Station is moving forward. This has been discussed, as a partnership between the Rapid, Grand Rapids Public Schools, and the W.K. Kellogg Foundation for several years. The RCS child care facility will have the capacity for approximately one hundred (100) customers. Given the scarcity and high cost of child-care it is hard to think of a better amenity for a transit center
- City leaders consider daycare at Rapid Central Station, WOODTV8 2022-04-21
- Part of downtown bus station could be turned into child care center in Grand Rapids, MLIVE 2022-06-08
- New childcare center could be coming to downtown Rapid bus station, FOX17 2022-07-13
Data: The U.S. Department of Health and Human Services recommends child care should cost no more than 7% of monthly income . . . today the typical American household with young children spends nearly 30% of its income on childcare. A typical home-owner household with young children spends ~66% of its income on the combination of housing and child care. 🥺
Ridership
Ridership continues to rebound towards pre-COVID levels. December of 2023 was up 9.6% from December of 2022, and overall fiscal year 2024 is up 7.2% so far compared to 2023. Calendar year ridership in 2023, compared to 2022, increased by over half a million riders (~543,679); with ridership increasing in every month.
Monthy Ridership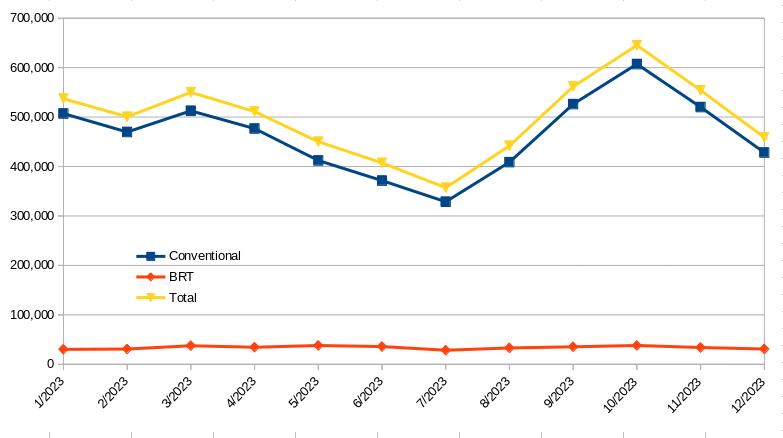 |
Ridership vs. 2022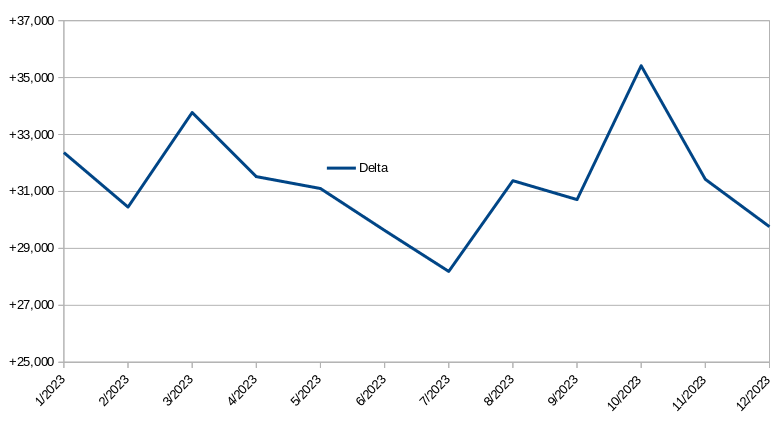 |
Riders Mode/Hour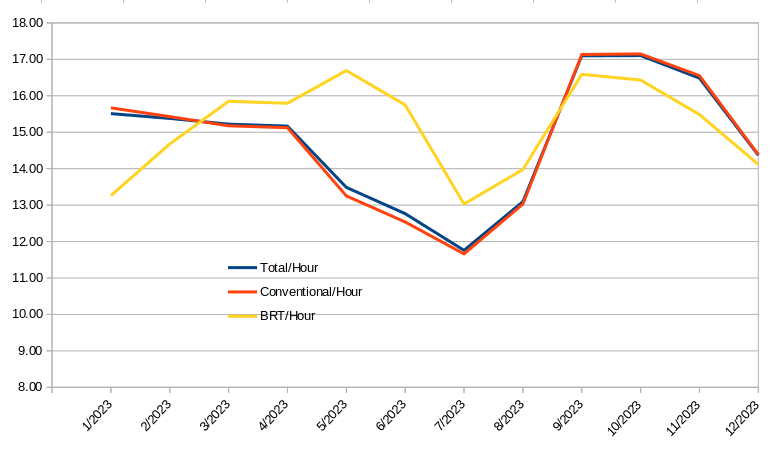 |
Riders Mode/Mile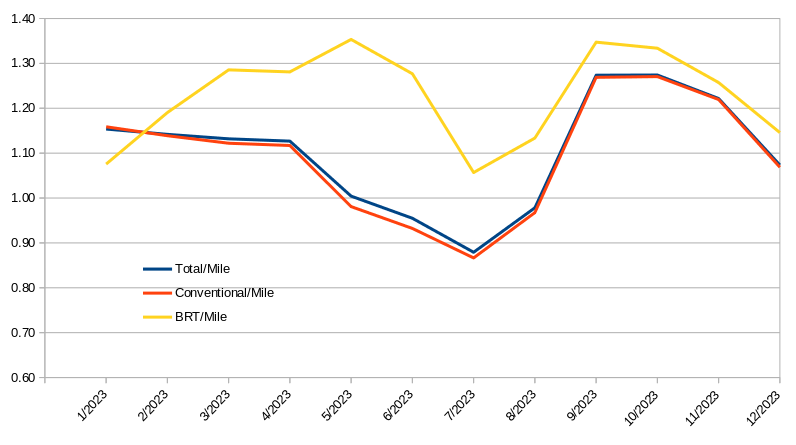 |
Mostly for simple curiosity I've also broken out trips-per-mile and trips-per-revenue-mile for the system, and both conventional vs. BRT bus. Any serious conclusions would require much greater analysis - and the ragged schedule of the Laker Line inhibits its use as a normal transit service - yet the lack of a substantial difference in trip generation is interesting. Operated as they are today, with the land-use regulations and development pattern we have today, neither BRT service seems to be creating much of a corridor effect. There likely are a variety of causes for that; but how the cities have ignored the investment made in the Silver Line has been disappointing.
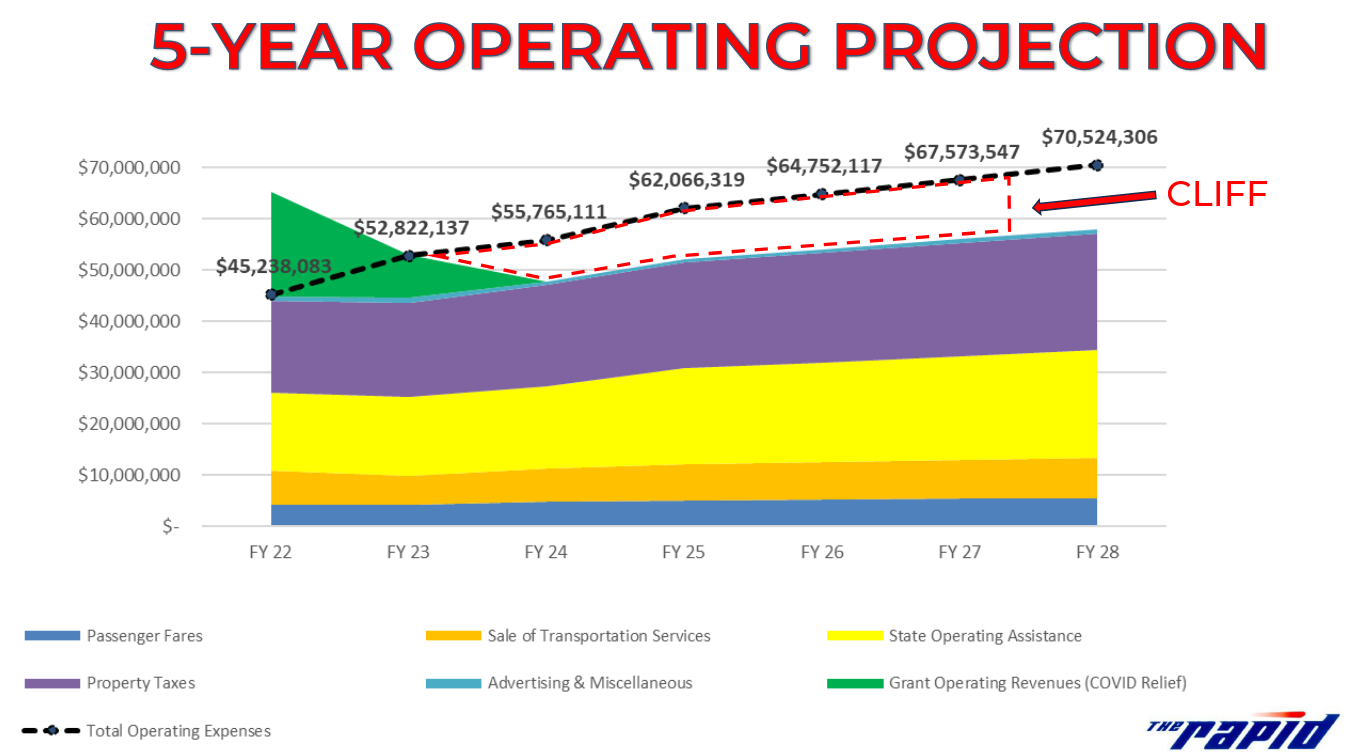
Transit Funding
While we are all thankful for the dauntless efforts of the Rapid's staff to sustain service in the face of declining resources the day of reckoning is coming. The fiscal cliff for Michigan's public transit agencies is approaching: ~2027. Despite lofty rhetoric about Climate Change and Economic Equity the Michigan Democratic Party's leaders remain profoundly uninterested in addressing this issue. Discussion of transportation funding reform is: 🦗🦗🦗
Gov. Whitmer has yet to appoint a chair to her Transportation Commission. It did not take her this long to borrow $3,500,000,000 to dump into the roads hole; ... we are talking about appointing someone to a commission. 😞
Doubling down on the status-quo in her State Of The State address Gov. Whitmer announced the idea of a tax rebate for households who purchase new vehicles. Such tax rebates disproportionately benefit higher income households.
In June of 2023 the governor established the bi-partisan Growing Michigan Together Council to address the issue of Michigan's population decline. The council delivered its report in December of 2023. The report is best described as vague and toothless. While chartered with laying out specifics - including cost estimates - the council delivered a brief document consisting of a pastiche of cut-n-paste recommendations from other reports.
The contents of the report are things like:
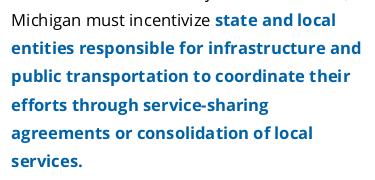
This is what having no plan but wanting to look like you have a plan looks like. 😞 A report was written and filed; box checked.
Somewhat more encouraging is the 👉Citizens Research Council of Michigan's Prosperous Future Report👈 released last September which at least had the courage to point out the trade-offs between land-use and fiscal sustainability.
The scene in Lansing is bleak, the absence of leadership profound. However, there are rumors of change. Before the COVID-19 pandemic deflated all sails there was talk of assembling a "transportation caucus" in the legislature; that conversation evaporated under the lazy doomerism of the pandemic. Remember people writing things like: "Will people ever go to bars again?" Yeah. 🙄 But it's back! Will the caucus materialize this time? It is too soon to say. Yet, there is a sliver of hope that change might be coming. And not a moment too soon.
| Aside:There is an unintended (is it ?) consequence of term-limits. Forming and maintaining caucus groups around particular topics is much harder. A two-term career doesn't leave a legislator much time to find their footing and build their network. It means that ~25% of their career is campaigning and the later part of their final term has to be about finding their next job. Michigan has paid a high but invisible price through the decline of the caucus. Personally, I have no doubt that the much discussed rise in "partisanship" is, in part, due to term-limits. Without the caucus being a legislator is, entirely naturally, less about legislating and more about campaigning. It is critical that we focus on electing candidates with clear and substantive policy agendas and perspectives. There is not time for self-discovery or on-the-job learning. Next time a state candidate knocks on your door ask about Public Act 51 of 1951, if they don't know what that is, tell them they do not have your support; hopefully that will motivate them to read something. |
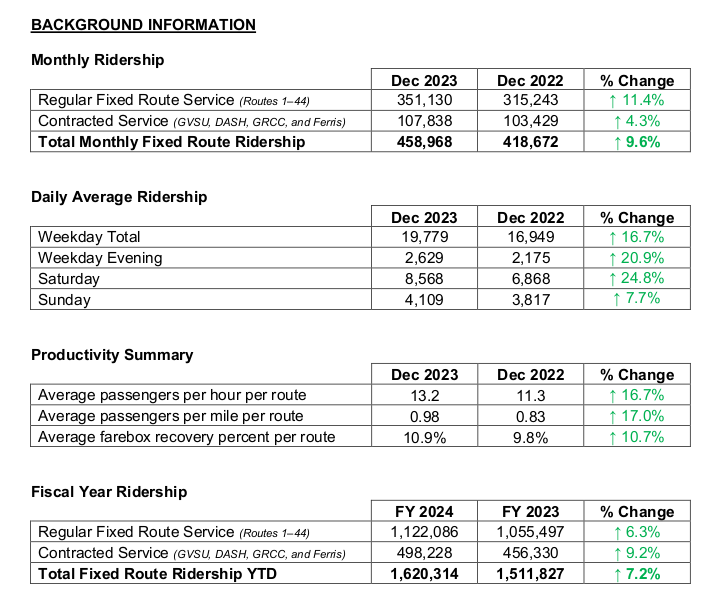
Bike Lanes
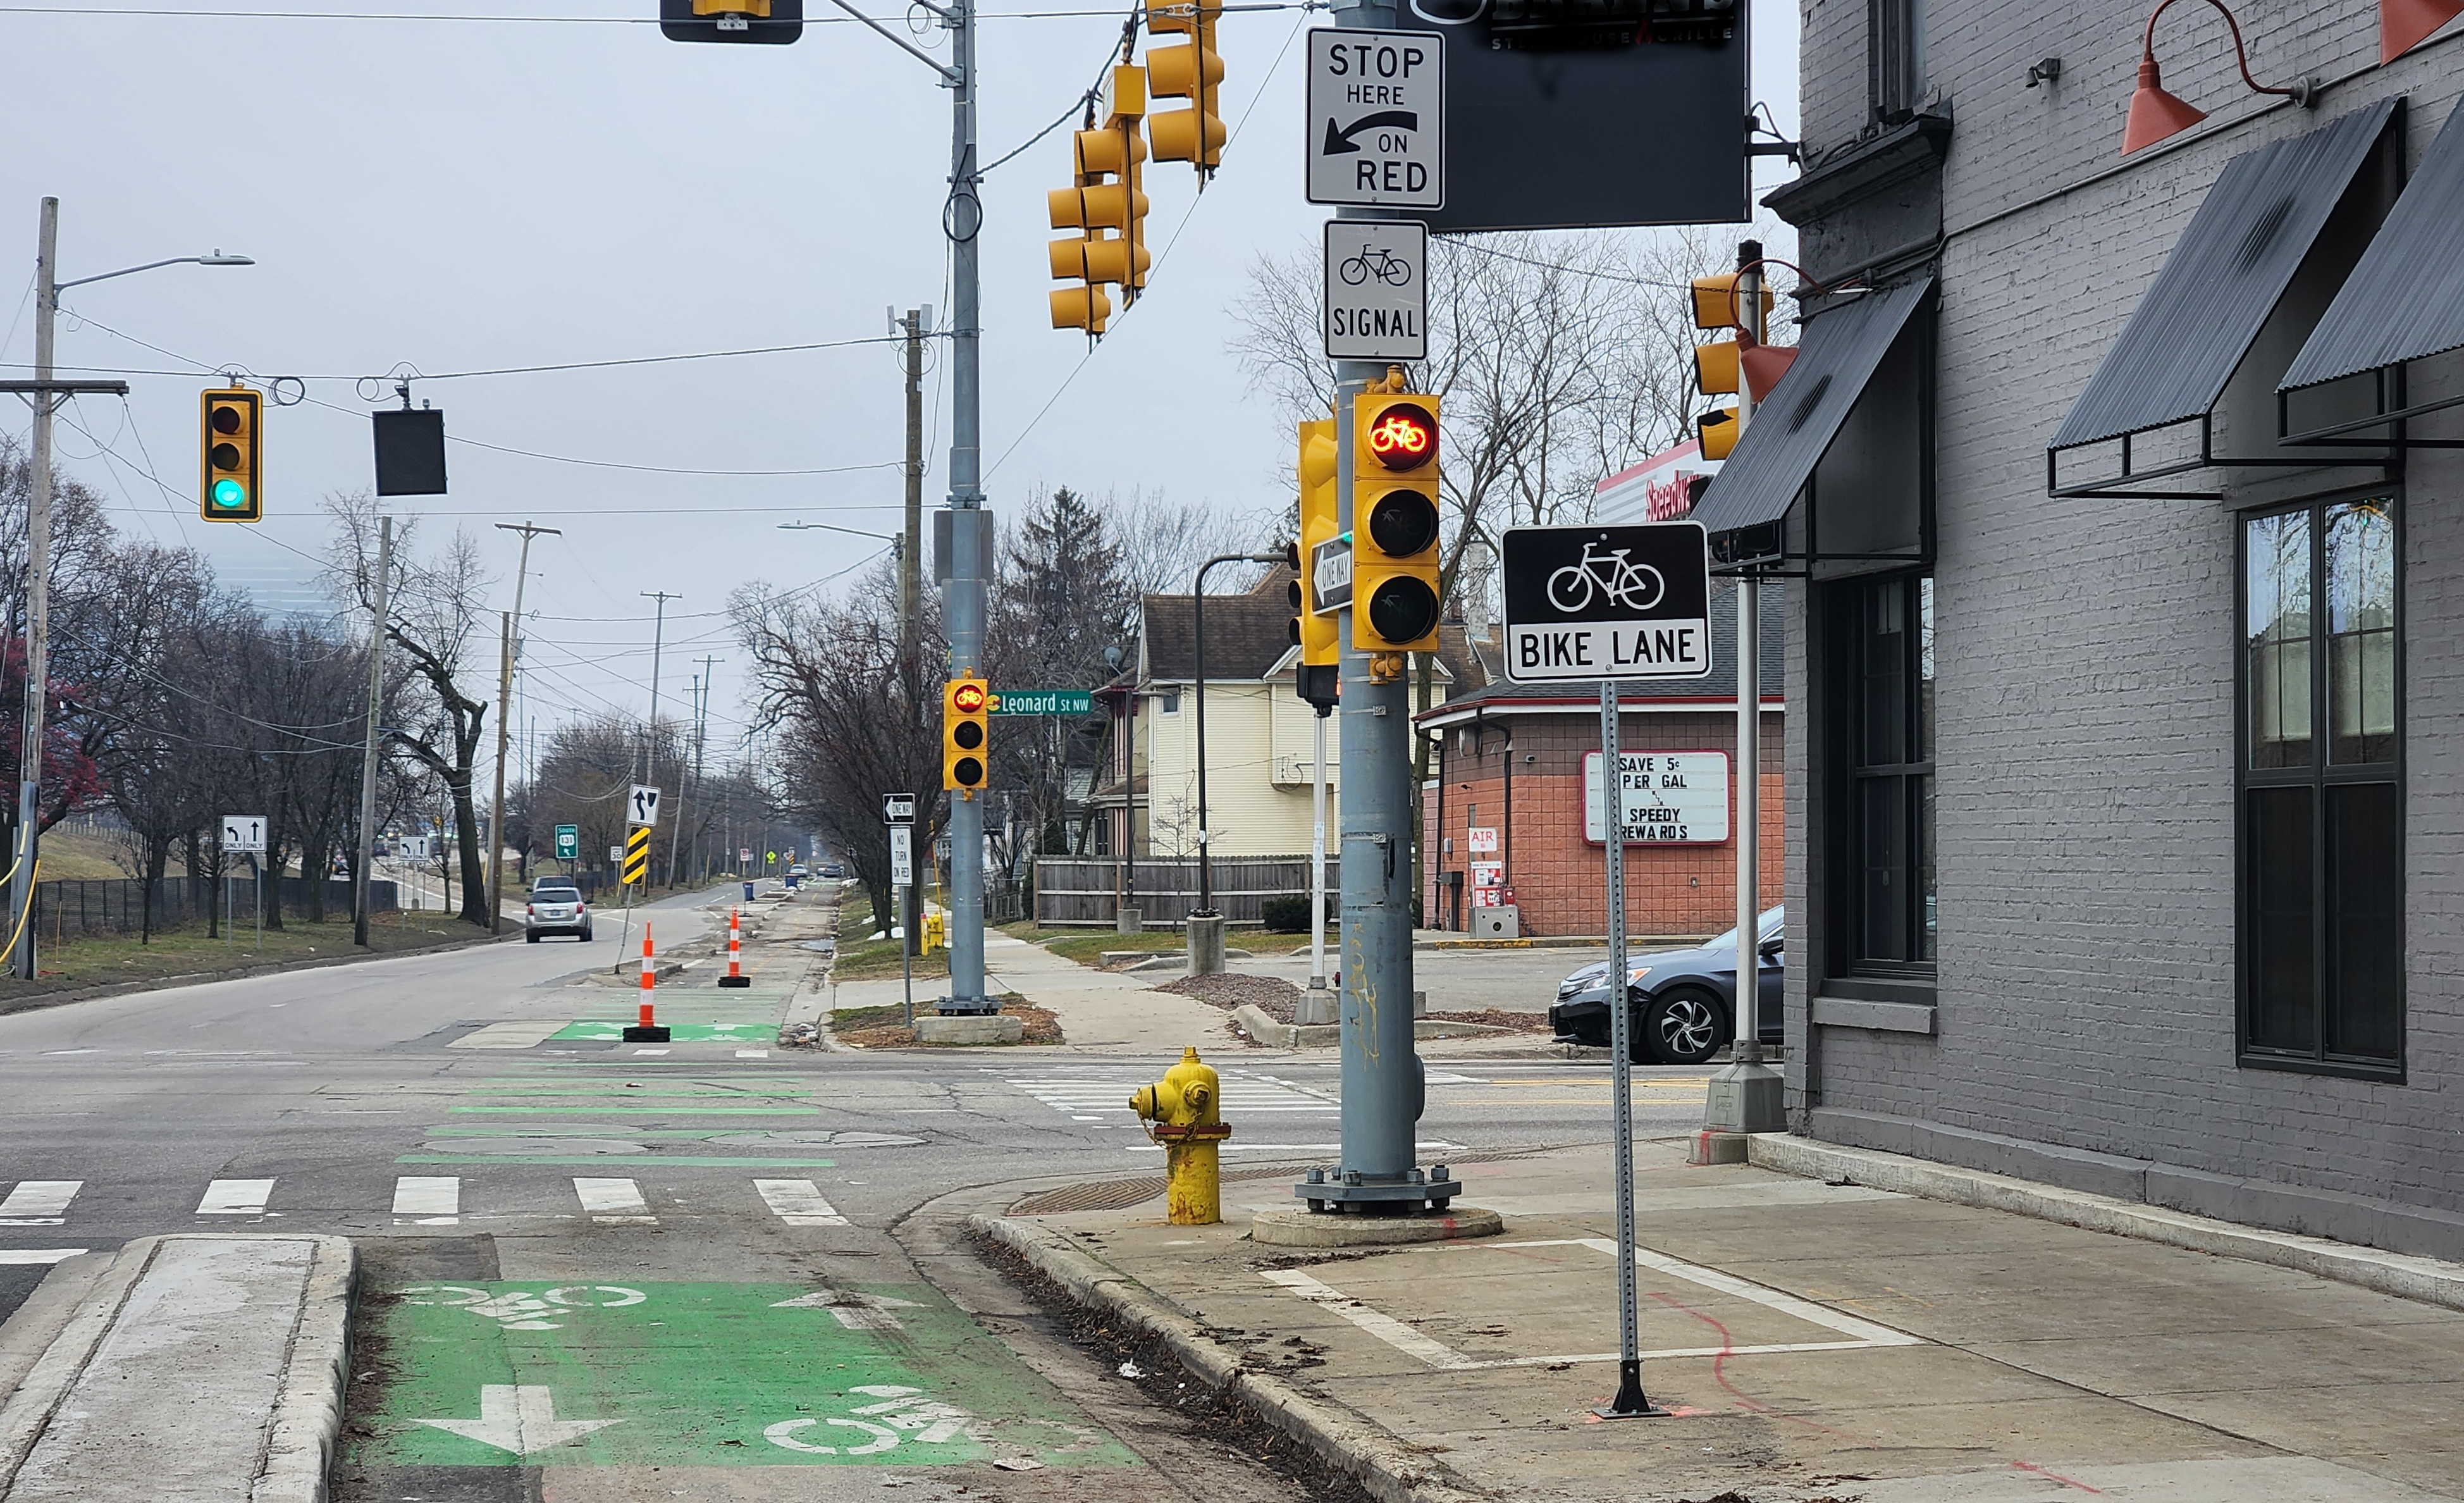
The Turner Ave bike lane is essentially complete. 👍 The bike signal at Leonard & Turner is now operational. This new bike lane made the list of best new bike lanes of 2023. 🙂
There have been some issues with Motorists parking in the bike lane as well as with snow clearing. It will be awhile until this type of infrastructure sinks in culturally, and for some Motorists it is going to require a basket of parking citations. Remember to report to 311 every time you see someone parked in a bike lane.
Before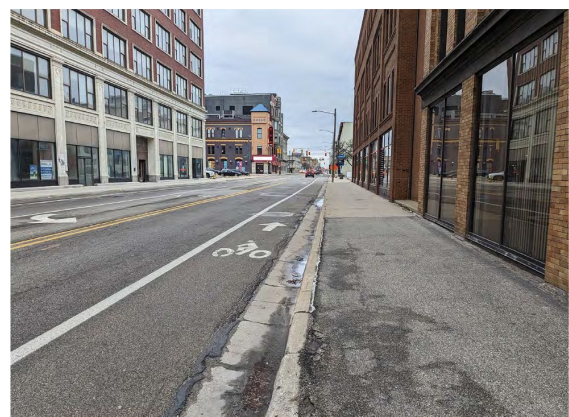 |
After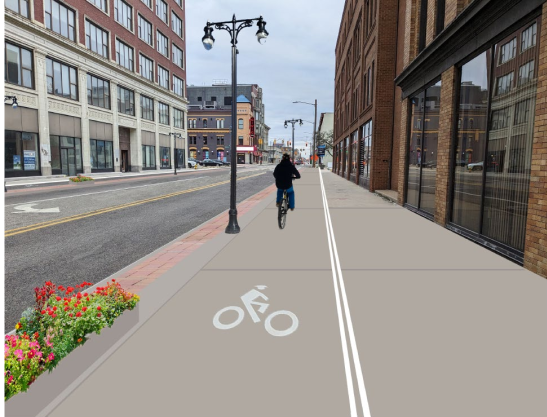 |
Map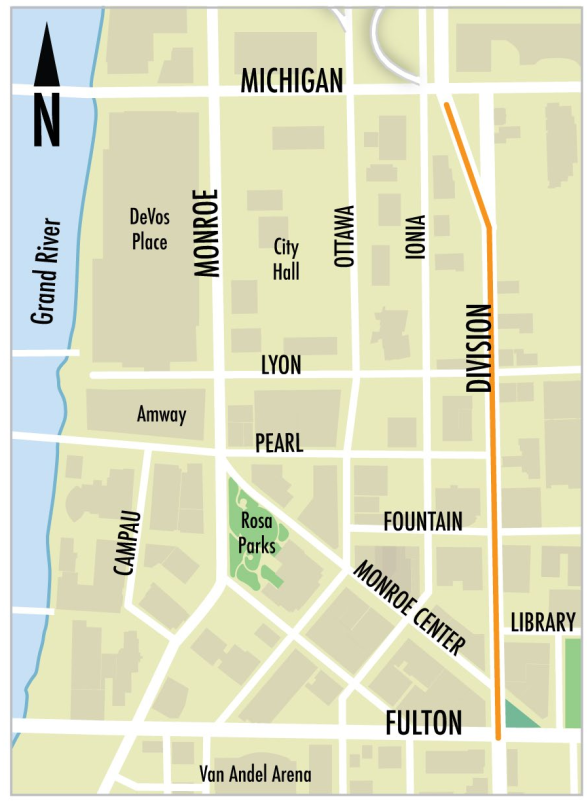 |
Starting with the closure of the Fulton St. and Division Ave intersection downtown is going to be particularly bad for Motorists this summer. Unfortunately this will also impact transit service. We should anticipate at least an initial decline in the Rapid's OTP (On-Time Performance), especially the DASH. The entire Division Ave corridor from Fulton St. north to Michigan St is going to be reconstructed, including AT&T and Consumers Energy doing extensive underground utility work. Underground utility work means l-o-n-g closures, the project will almost certainly last into November, and then it will resume next year (2025) for the entire summer. Upside: when finally complete the street will feature an elevated bike-lane and pedestrian improvements! A separated bike-lane on this major throughway has been a dream for more than a decade.
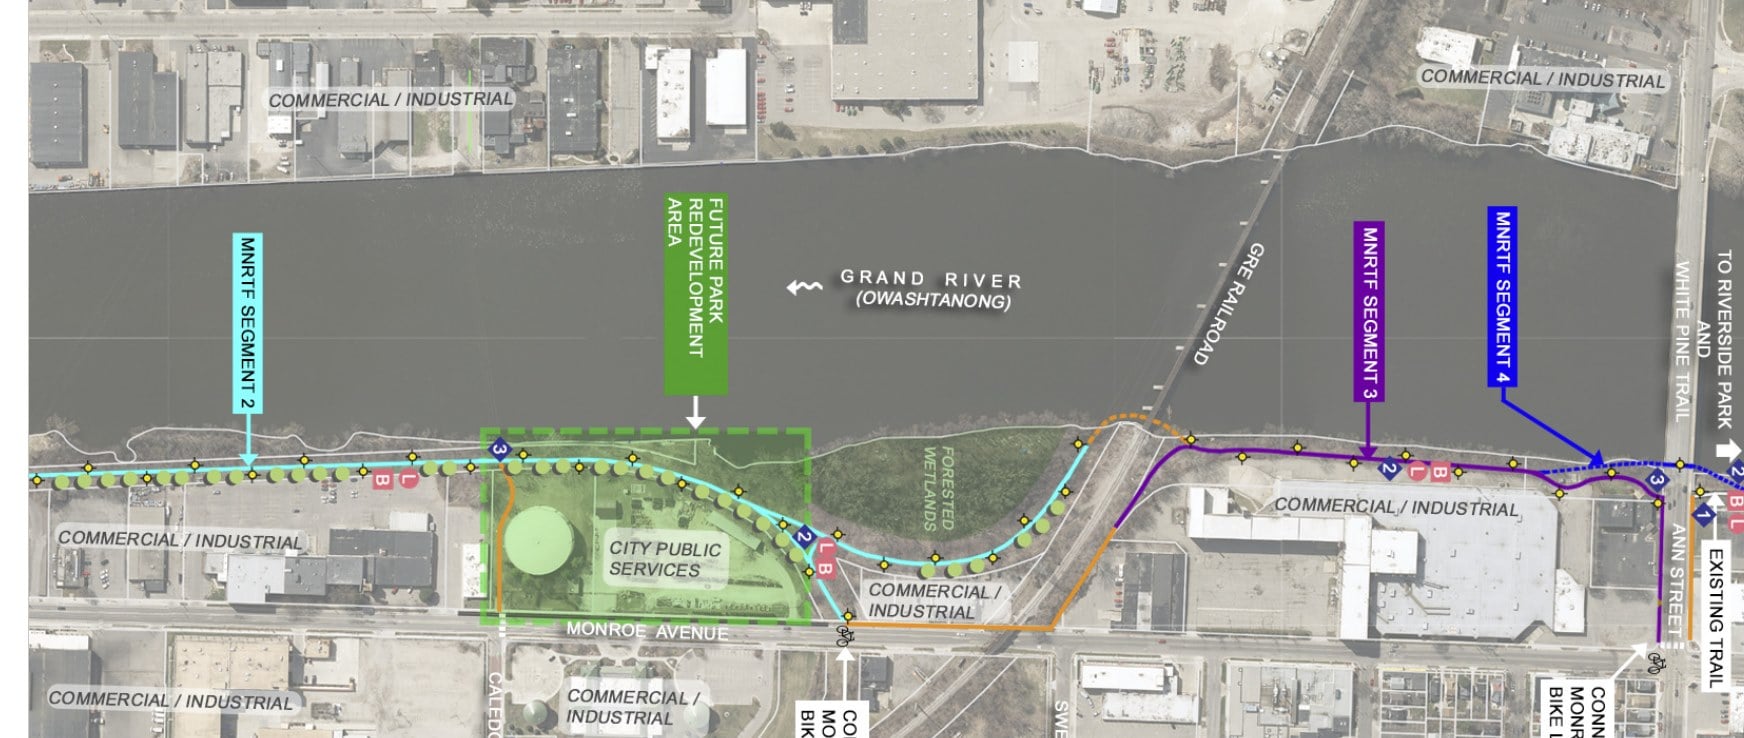
This path is part of the West Michigan Trails & Greenways Coalition's plan.
Car Share
This spring (2024) the city will debut, finally, a car-share program. It is a small "pilot" program. of six vehicles. Hopefully it will expand soon. The availability of car-share is an important amenity to facilitating the growth of both no-car and low-car households. With car-share available the occasional need for a car can be met; alternatively, occasional need requires the hassle of a rental or even car ownership [at which point the cognitive defects of both Cultural-Default and Sunk-Cost-Fallacy kick in].
The Grand Rapids municipal program will be app based and require a no-fee membership. The operator will verify the member's driving record and explain the program to each new member through an online call. Vehicles can be reserved in advance, for a specific amount of time. The cost will the $5/hr including up to 150 miles and then a $0.40 per mile beyond that. Drivers must be 21 years of age.
Most important, of course, where will the vehicles be?
| 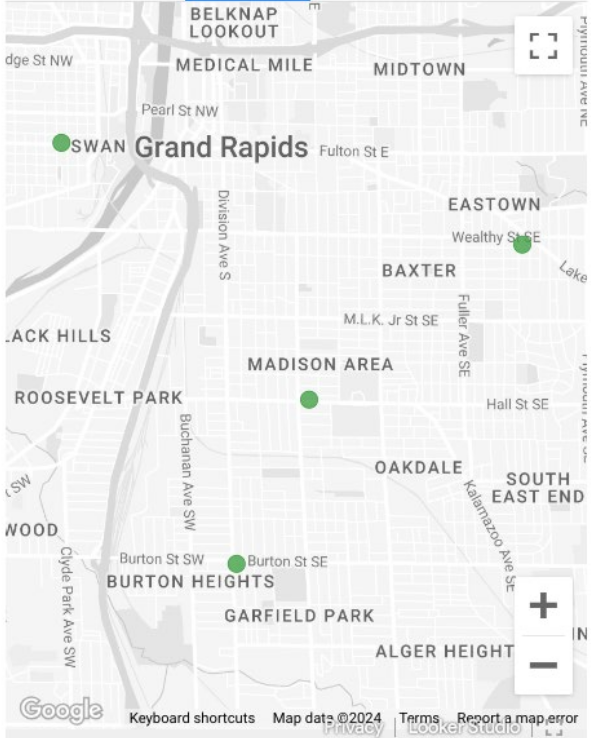 |
Zoning Reform
What? How is land-use about mobility? At least two ways; the first being that being development makes public transportation more fiscally sound [given the current funding regimes], and the second being that a minimum density makes public transportation much easier to sustain politically.
The topics of land-use and mobility are inextricably linked. Yet it is incorrect, or at least a severe over simplification, to say that land-use drives mode choices or infrastructure investment. In the United States it clearly does not. Land-use and infrastructure are straight-up public policy choices. Plenty of dense urban areas lack mobility infrastructure - and it is incredibly expensive to build/retrofit infrastructure in a dense urban place. And there is overbuilt infrastructure in some low density unproductive places; either because the density has declined [often intentionally; think Detroit] or because the infrastructure was built to encourage future development [sometimes that works, sometimes it does not]. It is correct that land-use and infrastructure should mirror each other, but that is a public policy choice, it is not something which occurs naturally.
Reason #1: Infill Development Is Public Transit Revenue
We've already discussed the disinterest in governor's office to address urban issues, particularly around transportation. As well as the coming fiscal cliff. Yet, we do have one arrow in the quiver for the funding of public transportation: infill development. Will it solve the cliff? No. Yet it can stretch the slope. The local property tax millage is the Rapid's one and only source of consistent-ish funding. At a glace you'd think the Rapid would be flush with cash? Have you seen housing prices! But due to the particularities of Michigan's property tax system the Rapid sees little benefit from escalating property values; our property tax system is rigged to prevent affluent households from paying taxes on their appreciating assets. The caveat is that this sheltering of the affluent only applies to historic investments while new investments get taxed on a more appropriate basis. This means that infill development produces revenue for the Rapid.
Thanks to the diligent work of a fellow Strongtowns GR member 👉there is finally a value-per-parcel map of Grand Rapids👈.. It shows what everyone paying attention already knows: downtown and the central city float everyone else, financially. It also shows another important detail: the value of infill development.
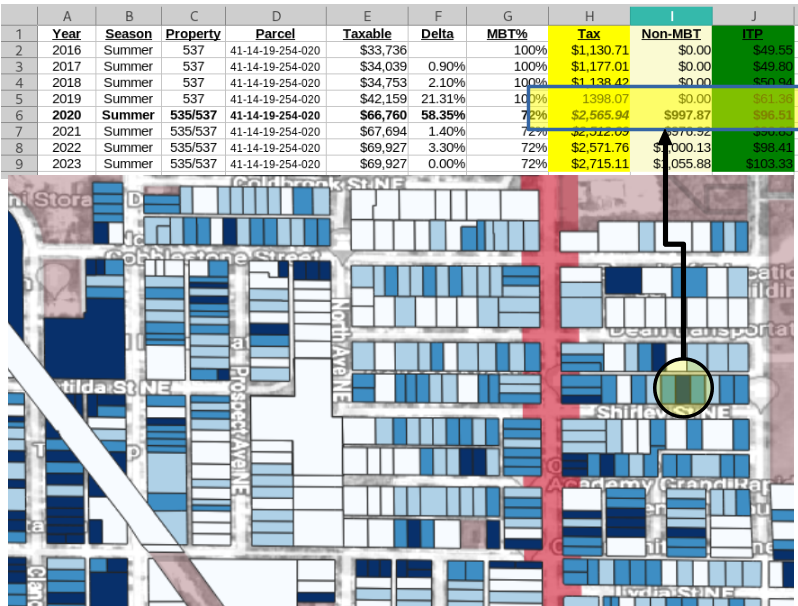
Just the construction of an ADU increased the property tax I have the privilege of paying to the ITP millage (the Rapid) by 30%! Any development pushes a parcel out a little bit out from under the umbrella of Michigan's regressive tax regime. Darker parcels on the map represent higher taxable value; on top are the property taxes I have paid on this parcel, before and after the construction of an ADU.
Scrolling around on the 👉value-per-parcel map of Grand Rapids👈. it is clear that the desire to prevent any-and-all change in the neighborhoods, layered on top of Michigan's regressive tax regime, is starving our public services and infrastructure. Infill development is one tool we have to unlock the latent value of the city. This is not a panacea, all the crisis persist, but this is nearly the only tool we have at a local level. And we cannot depend on anyone else coming to save us; we should maximize the use of the tool we have.
Reason #2: Households are the riders
Dense residential clusters and corridors support transit service, as the people right there are the most likely users. While park-n-rides and like services can be helpful in some circumstances, a greater share of people at a transit node are likely to ride than people already traveling by another node. Especially in American cities which tax and fee their citizens in order to provide free parking their own citizens do not need. The general consensus is that 👉12👈 to 👉15 (PDF)👈 households per acre are necessary to provide a service with consistent ridership.
The typical household density for single unit [aka: "single family"] detached construction is eight (8), while two story townhouses can provide a density as high as forty (40) units per acre. Even small apartment buildings can create densities of eighty (80) units per acre. There are many types and forms of residential density, at least once you leave the notion of the single unit detached "house" behind.
The blocks in Grand Rapid's neighborhoods are generally ~4 (four) acres; some a bit more, a few a bit less. Thus, a transit supportive block is in the range of 48 to 60 units.
A Block: Shirley/Walnut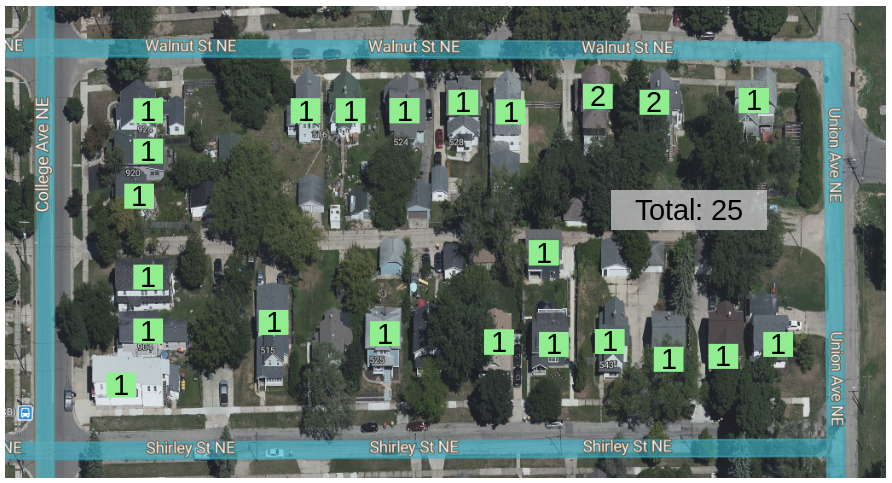 |
A Block: Walnut/Cedar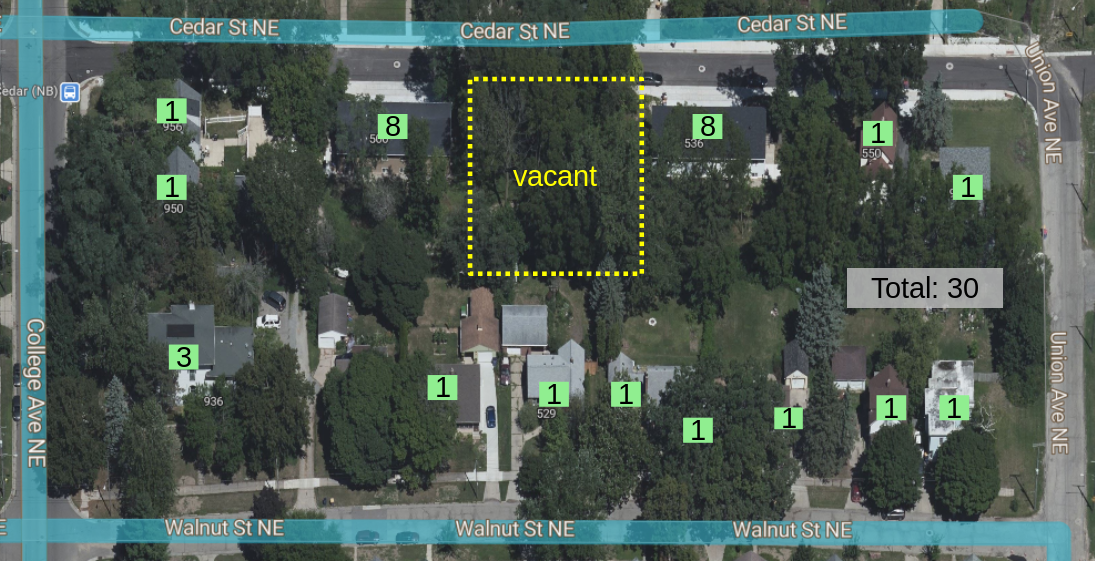 |
My own block (~620ft x ~310ft) is 195,200sq/ft, or 4.48 acres. There are 25 residential units; 21 single unit detached, two duplexes, one ADU, and one apartment over a commercial space. It's a pretty normal first-ring subdivision development pattern. It is between five (5) and six (6) units per acre; it needs twenty three (23) additional units to get to a transit supportive density. That is wildly improbable, regardless of zoning regulations. However, just the next block north, which features the same generous open space and abundant tree cover has a 30 units. It also has a large vacant parcel. The point that density can have a great variety of forms is important, too often people hear "density" and think high-rises or rows upon row of apartment blocks. The reality is that there is room on an average city block for a variety of building types, including single unit detached. Both of these blocks can support additional density with no dramatic change. Nodes of greater density also help to increase the average density of a corridor.
The 👉currently proposed land-use reforms👈 would allow for conversions of single family properties to a modestly greater density along the major streets as well as allowing the construction of Accessory Dwelling Units without arbitrary regulatory hassle. Assuming a modest amount of infill development over the next decade both of these blocks could grow, and one achieve, a transit supportive density. If that materializes depends on many things, not merely land-use reform, yet as they kids say "necessary but not sufficient". Conversations with neighbors make it clear that investment is something they are interested in, given conducive regulations, reasonable interest rates, and the availability of labor. One of those criteria can be achieved by the City Commission with the stroke of a pen.
| A Possible Block: Shirley/Walnut [2034] |
A Possible Block: Walnut/Cedar [2034] |
Again, we should use the few tools we have to their maximum.
Related
- How Michigan does (and does not) fund public transportation, Strongtowns GR 2023-12
- 5 ways Grand Rapids may boost housing supply and affordability, Crains 2024-01
- Housing Next studies 21 key corridors ripe for potential redevelopment, Crains 2024-01-29
- Time for Michigan to Double State Investment in Transit!, TRU 2024-01-15
- Planning Agenda: 2024-01-25, UrbanGR (Zoning Reforms)
- Heritage Hill "Density" Discussion, UrbanGR 2024-01-03
- The Beginning Of The End (of The Rapid)?, UrbanGR 2023-12-21
- Why Michigan Should Embrace Zoning Reform, Mackinac Center Video 2023-11-11