Years To Buy, 2022
Submitted by whitemice on Mon, 09/26/2022 - 06:55
Some maps flew around social media of housing costs by county. Those maps used the Median MLS Listing Price divided by the county's median income to calculate the years-to-buy metric. The years-to-buy metric is a common way to correlate housing prices to regional income. Unfortunately the low granularity of county level data hides a great deal of variability. Inspired by those maps a local advocate recalculated the data by zip code and posted them to the Strongtown's slack.
Note: This map uses the Zillow Home Value Index instead of the Median MLS Listing Price used by the county level maps
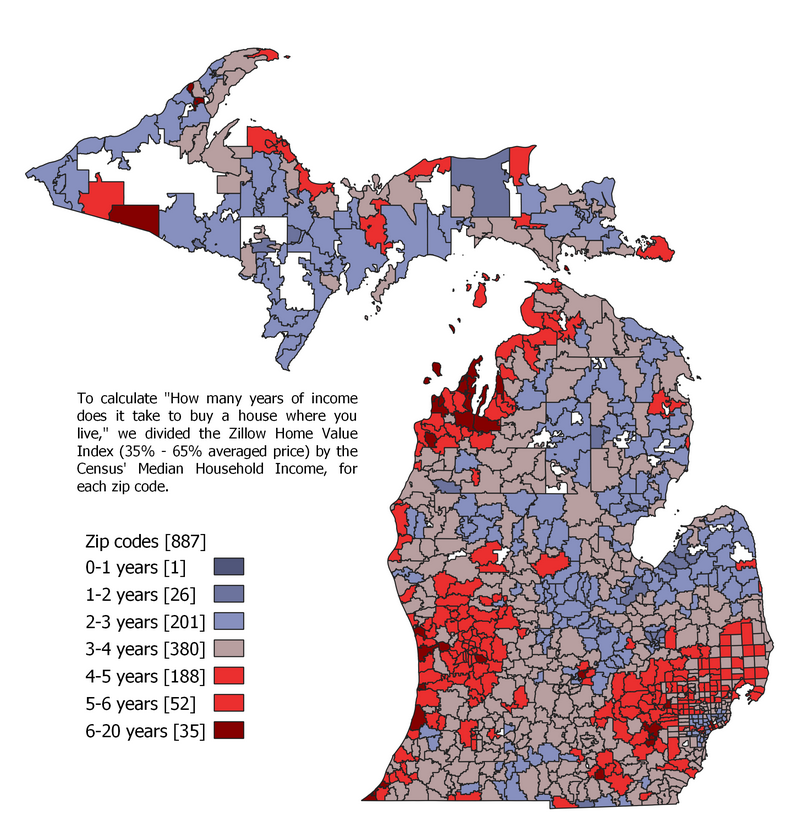
The correlation of housing prices to employment density and amenities is clear.