Commute Mode Share & Time (2021-2023)
Submitted by whitemice on Mon, 09/15/2025 - 12:53
Two years ago we published "How We Commute" based on what was then the latest community survey data from 2021. We now have data up through 2023. Given the significant decline in traffic will we see any changes in commute times and mode share?
In summary:
- Motorists bumped up slightly in 2022, but then has been flat through 2023. Overall +2.23%
- Public transportation's mode share increased by 1.68%
- Other, which includes walking and biking, increased by 1.13%
- And, work-from-home decreased by 3.84%.
- The largest shift in commute times was a 6.83% drop in those with a commute time of 10 - 29 minutes, which is the majority of commuters.
- Both micro-commuters (less than 10 minutes) and super-commuters (more than 60 minutes) increased, +3.97% and +3.2% respectively.
Commute Mode Share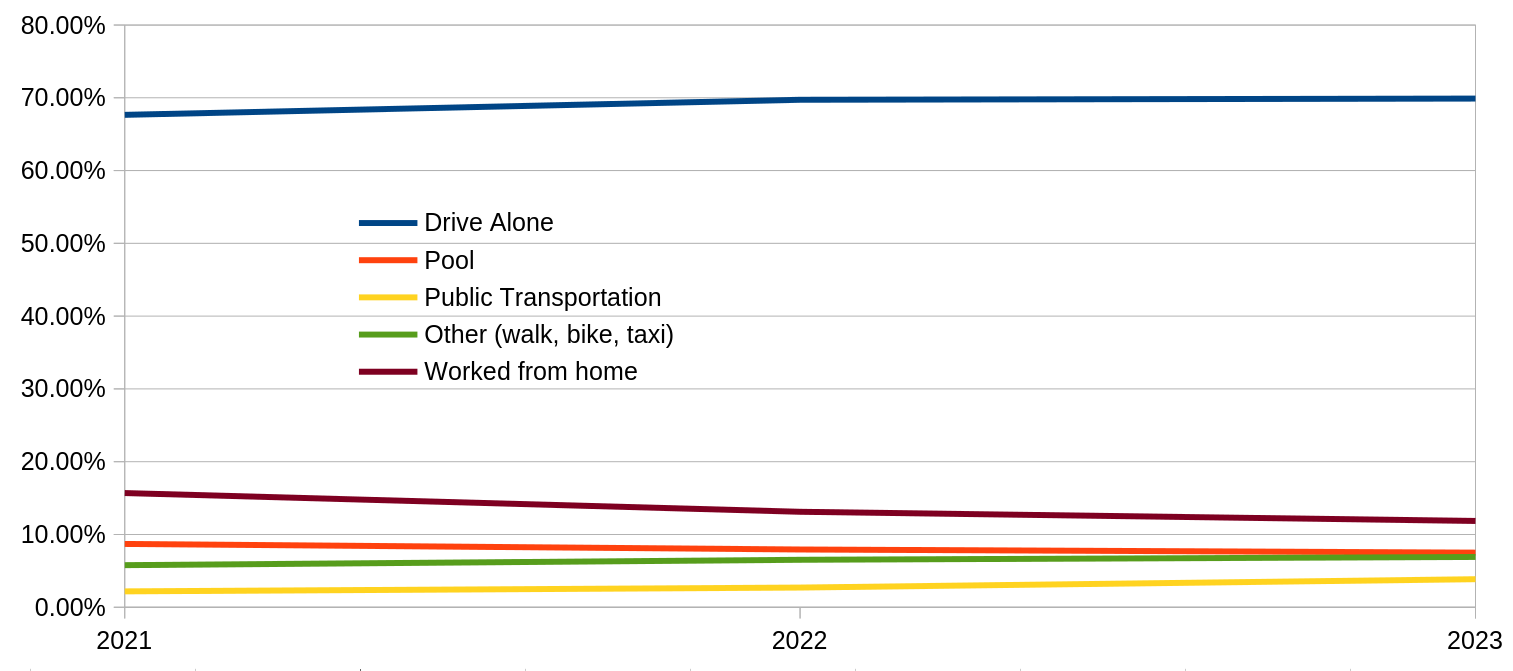
|
Commute Times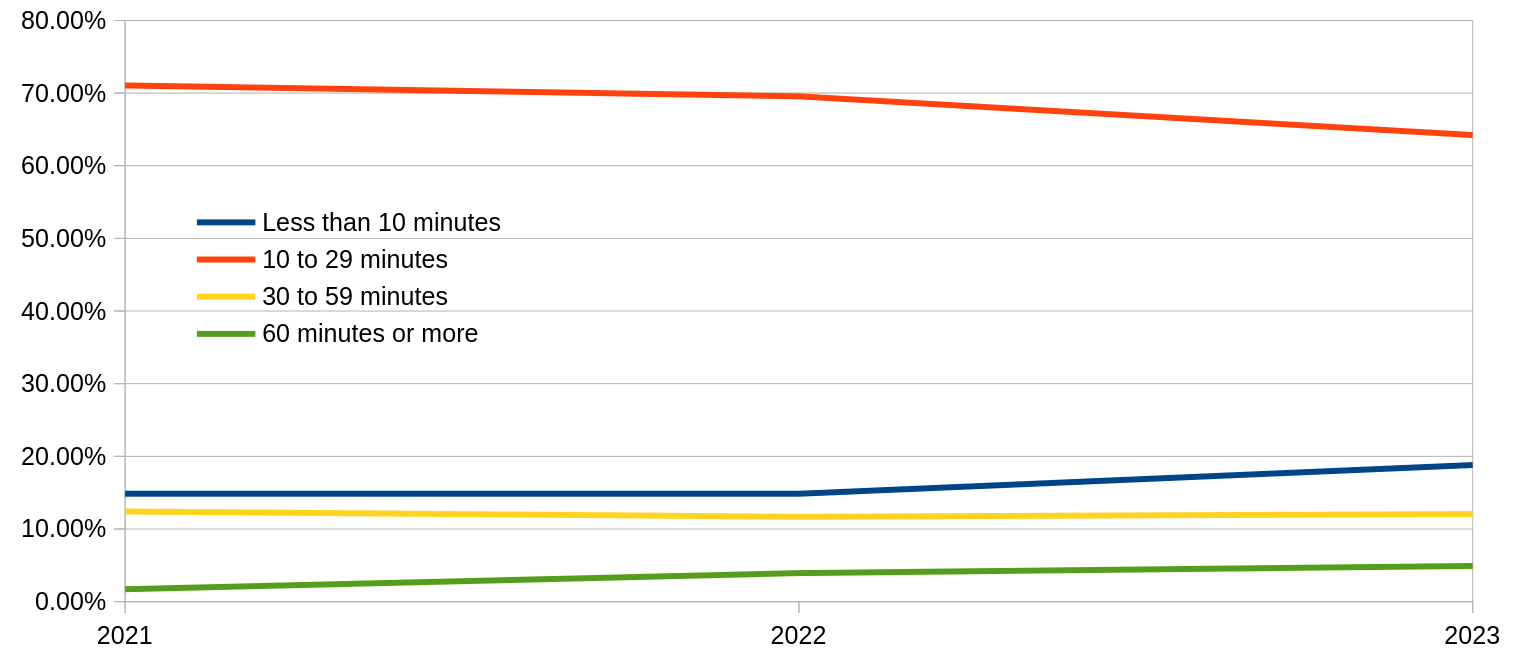
|
Note: Always keep in mind that while there is an institutional focus on commuting, and the census has - at least historically - had a focus on commuting trips, commuting related trips are less than 17% of all trips taken.
The Data
| Category | 2021 | 2022 | 2023 |
|---|---|---|---|
| Drive Alone | 67.66% | 69.72% | 69.89% |
| Car Pool | 8.69% | 7.94% | 7.50% |
| Public Transportation | 2.17% | 2.71% | 3.85% |
| Other (walk, bike, taxi) | 5.78% | 6.51% | 6.91% |
| Worked from home | 15.69% | 13.12% | 11.85% |
| Less than 10 minutes | 14.84% | 14.85% | 18.81% |
| 10 to 29 minutes | 71.05% | 69.55% | 64.22% |
| 30 to 59 minutes | 12.40% | 11.67% | 12.06% |
| 60 minutes or more | 1.71% | 3.93% | 4.91% |