Submitted by whitemice on Fri, 08/25/2023 - 10:07
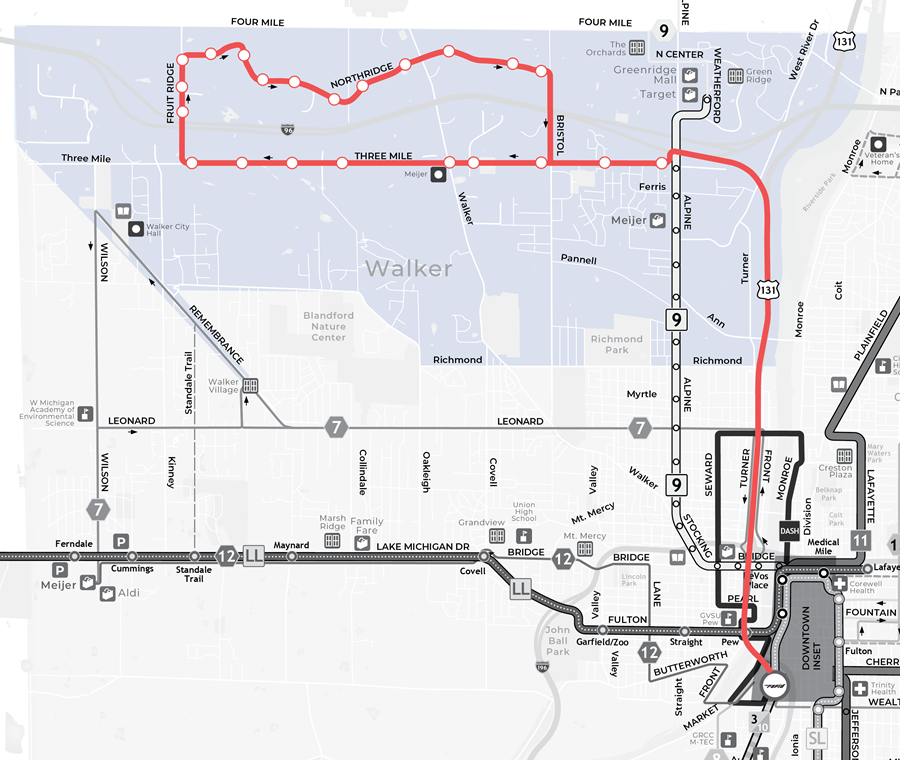
Route #33
The Rapid will begin operating a weekday express route to the Walker industrial park. The industrial park was previously served by an interline with route #9 (Alpine) - - - which was very confusing.
Route 33 will run hourly from 5:45am - 10:45am and 1:45pm - 5:45pm, Monday through Friday.
Submitted by whitemice on Sun, 08/20/2023 - 16:01
Within 👉the minutes of the 2023-05 Rapid Planning meeting👈 is an interesting conversation about the future - or perceived future - of mobility in the region. This group plays an instrumental role in drafting the plan for the future of the Rapid; which for bureaucratic & regulatory reasons happens in twenty (20) year increments. Yes, a 20 year plan seems absurd; something the participants of this body appear to be aware of.
Submitted by whitemice on Fri, 08/11/2023 - 18:42
Submitted by whitemice on Fri, 02/17/2023 - 06:48
Submitted by whitemice on Mon, 10/17/2022 - 07:16
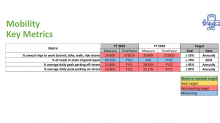
The City's Strategic Plan sets a transportation mode shift goal of 55% by 2035; meaning that 55% of commuter trips would be made via a mode other than by a single occupant vehicle [aka: a car, or in the 21st Century, more accurately: "a massive SUV or pickup"].
Submitted by whitemice on Thu, 01/28/2021 - 06:54
Preamble: This is a post about the neighborhood of Highland Park by a resident.
In response to the previous post - Fantasy Map (Parks) - someone pointed out that part of the answer has to be connectivity. An alternative to making more of something closer to where someone is, is to make what exists closer. AKA: connectivity. Something may be nearby, yet if there is a barrier between you and it, then it is effectively further away. This is a good point. So, before we can talk about more issues like paths or trails or housing or commerce we need to take a step back and look at the neighborhoods connectivity.
Submitted by whitemice on Tue, 02/25/2020 - 19:48
Everyone loves maps, and the RAPID's "Mobility For All" survey is up. You check out the survey, think about it, and provide feedback. This survey supports the required Comprehensive Operational Analysis which will determine the next phase of the RAPID's operation.
Now, the maps....
Pages